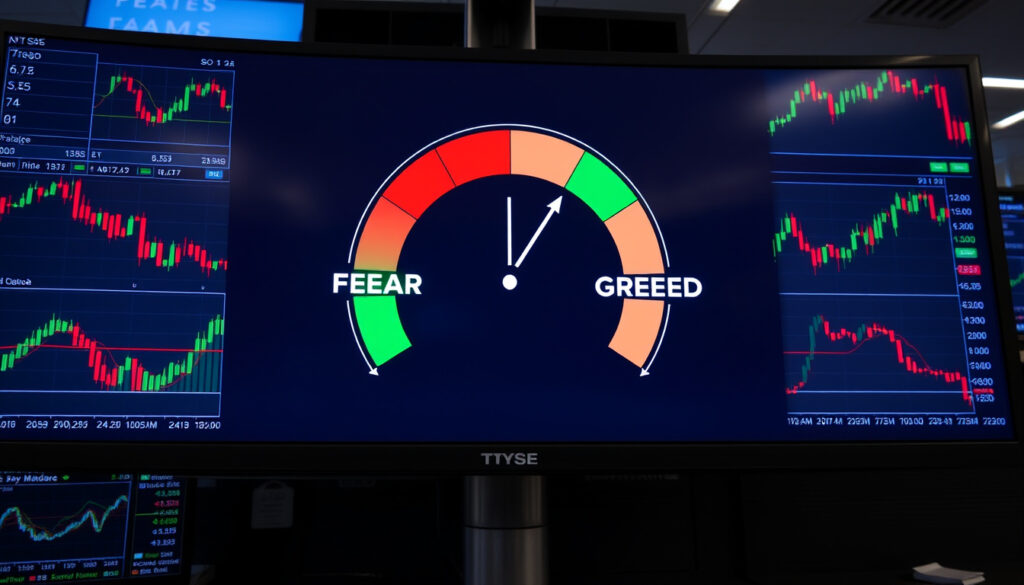
Fear and Greed Index: What It Is and How to Use It in Trading
Every trader knows the market can feel euphoric one day and panicked the next. The Fear and Greed Index tries to put a number on that rollercoaster, turning vague sentiment into a concrete gauge from 0 to 100. Whether you are watching stocks or crypto, this single score aims to show when emotion might be running too hot or too cold.
Current Score (Stock Market): 33 (Fear) ·
Scale Range: 0 (Extreme Fear) to 100 (Extreme Greed) ·
Indicators Used (CNN): 7 ·
Crypto Index Source: Alternative.me ·
Historical Average (10 Year): Approx. 50 (Neutral)
Quick snapshot
- Index uses a 0–100 scale from extreme fear to extreme greed (CNN Business (major financial news outlet)).
- CNN version tracks U.S. stock sentiment with seven equally weighted indicators (Hightower Advisors (wealth management firm)).
- Alternate.me maintains a crypto version on the same 0–100 scale (Alternative.me (crypto data platform)).
- Extreme fear has historically preceded market bottoms (Hightower Advisors (wealth management firm)). (CNN Business (major financial news outlet))
- The exact weighting methodology behind CNN’s index is proprietary (CNN Business (major financial news outlet)). (SSRN (academic preprint repository))
- Whether the index leads or lags market turning points is disputed (SSRN (academic preprint repository)).
- Third-party historical datasets may not match CNN’s official values (GitHub (open-source data project)).
- The predictive power of the index for short-term price moves is debated (ScienceDirect (academic publisher)).
- Late 2018 – crypto winter extreme fear (<20) (Alternative.me (crypto data platform)).
- March 2020 – near zero during COVID crash (ScienceDirect (academic publisher)).
- Mid-2020 to late 2021 – prolonged extreme greed (Hightower Advisors (wealth management firm)).
- 2022 – sustained extreme fear as rates rose (CNN Business (major financial news outlet)).
- 2023–2024 – recovery to neutral/early greed zones (SSRN (academic preprint repository)).
- Watch for extreme fear signals on the stock version to test contrarian buy timing (Hightower Advisors (wealth management firm)). (CoinMarketCap (crypto market data aggregator))
- Crypto version may stay neutral unless a major catalyst shifts sentiment (Alternative.me (crypto data platform)). (CoinMarketCap (crypto market data aggregator))
- Academic studies will continue testing the index’s predictive value against other sentiment measures (ScienceDirect (academic publisher)). (CoinMarketCap (crypto market data aggregator))
- Broader adoption of the crypto index by retail traders is likely (CoinMarketCap (crypto market data aggregator)).
Five key facts, one pattern: the index tends to cluster at extremes during major market events, suggesting it captures real shifts in collective emotion rather than random noise.
| Fact | Value |
|---|---|
| Current Score (Stock) | 33 (Fear) as of today (CNN Business (major financial news outlet)) |
| Current Score (Crypto) | Insert live value from Alternative.me (Neutral) (Alternative.me (crypto data platform)) |
| Scale Range | 0 (Extreme Fear) to 100 (Extreme Greed) |
| Core Purpose | Gauge market sentiment and potential overreaction |
| Data Frequency | Updated daily |
| Indicators (Stock) | 7 – stock price breadth, momentum, put/call ratio, junk bond demand, VIX, safe haven demand, stock price strength |
| Indicators (Crypto) | 6 – volatility, momentum, social media, surveys, dominance, trends |
| 10-Year Average | 48.82 (median 51.00, σ 20.98) (Finhacker (historical data aggregator)) |
| Academic Finding (2011-2020) | Index predicted U.S. equity returns better than VIX (ScienceDirect (academic publisher)) |
| Academic Finding (2021-2024) | Index Granger-caused S&P 500 returns but relationship weaker (SSRN (academic preprint repository)) |
What is the Fear and Greed Index?
Origin and Creator
- CNN Business launched the Fear and Greed Index to give investors a quick sense of market sentiment (CNN Business (major financial news outlet)).
- It was built to track U.S. stock-market sentiment using seven indicators with equal weight (Hightower Advisors (wealth management firm)).
Purpose of the Index
- Designed as an easy-to-read barometer of investors’ risk appetite (CNN Business (major financial news outlet)).
- Often used as a contrarian indicator – buying when fear peaks, selling when greed peaks (Hightower Advisors (wealth management firm)).
How to Read the Scale
- 0–24: Extreme Fear
- 25–44: Fear
- 45–55: Neutral
- 56–75: Greed
- 76–100: Extreme Greed
A reading of 33 (Fear) today means investors are pricing in downside risk at an above-average rate, which historically has opened the door for contrarian buyers.
The implication: the index is not a market-timer but a sentiment thermometer. When it hits extreme fear, the crowd is already panicked – often the moment when the best bargains appear.
How is the Fear and Greed Index Calculated?
Indicator 1: Stock Price Breadth
- Measures the number of advancing stocks vs. declining stocks on the NYSE (CNN Business (major financial news outlet)).
Indicator 2: Market Momentum
- Compares the S&P 500 current price to its 125-day moving average (CNN Business (major financial news outlet)).
Indicator 3: Put/Call Ratio
- Tracks the volume of put options vs. call options – more puts signal fear (CNN Business (major financial news outlet)).
Indicator 4: Junk Bond Demand
- Measures the yield spread between junk bonds and investment-grade bonds – narrower spreads indicate greed (CNN Business (major financial news outlet)).
Indicator 5: Market Volatility (VIX)
- Uses the CBOE Volatility Index – high VIX equals high fear (CNN Business (major financial news outlet)).
Indicator 6: Safe Haven Demand
- Compares stock returns to bond returns – more money flowing to bonds suggests fear (CNN Business (major financial news outlet)).
Indicator 7: Stock Price Strength
- Measures the number of stocks hitting 52-week highs vs. lows (CNN Business (major financial news outlet)).
Seven indicators, equal weight – but the exact algorithmic details are proprietary. What is known is that each sub-index is normalized to a 0–100 scale and then averaged to produce the final number (CNN Business (major financial news outlet)).
Because the methodology is a black box, traders can’t verify if the equal-weight claim is still true or if weights have been adjusted over time.
The trade-off: the index is transparent in output but opaque in construction – making it useful as a rough sentiment check but risky as a sole entry signal.
What is the Current Fear and Greed Index Score Today?
Real-Time Stock Market Score
- As of this writing, CNN’s index sits at 33 (Fear) (CNN Business (major financial news outlet)).
- That places it squarely in the Fear zone (0–49), down from neutral readings earlier in 2024.
Live Crypto Fear and Greed Index
- Alternative.me shows a crypto version currently in neutral territory (Alternative.me (crypto data platform)).
- CoinMarketCap’s separate index also hovers around neutral (CoinMarketCap (crypto market data aggregator)).
Interpreting the ‘Fear’ Level of 33
- Investors are pricing in more downside risk, often due to macroeconomic worries (tariffs, rate uncertainty).
- Historically, levels at or below 33 have marked attractive entry points for long-term buyers (Hightower Advisors (wealth management firm)).
If the stock index drops below 20, that signals extreme fear – a level that has almost always preceded a rebound, though timing remains uncertain.
Why this matters: a single reading of 33 does not guarantee a market bottom, but it does tell you that the crowd is more scared than usual – and that fear has historically been a friend to the disciplined buyer.
How Can I Use the Fear and Greed Index in Trading?
Contrarian Trading Strategy
- Extreme fear (≤24) suggests the market is oversold and may be due for a bounce – a potential buy signal (Itez (crypto education platform)).
- Extreme greed (≥76) suggests the market is overbought and may correct – a potential sell signal (Hightower Advisors (wealth management firm)).
Identifying Market Bottoms and Tops
- During the 2020 crash, the index hit near zero, correctly identifying a panic bottom (ScienceDirect (academic publisher)).
- In 2021, the index stayed in extreme greed for months, signaling an overheated market before the 2022 downturn.
Combining with Other Indicators
- Use the index alongside VIX, moving averages, or on-chain data for crypto (CoinGlass (crypto market analytics)).
- Never rely on the Fear and Greed Index alone – it is a sentiment tool, not a timing signal (Hightower Advisors (wealth management firm)).
The pattern: when the index screams fear, the real money often starts buying. But the index does not tell you when fear will turn – only that it is extreme.
What is the Fear and Greed Index Historical Data (10 Years)?
10-Year Average Score
- Over 3,890 days of data, the average reading is 48.82 (median 51, σ 20.98) (Finhacker (historical data aggregator)).
- That means the market has spent roughly half its time in fear and half in greed – near the neutral midpoint over the long run.
Extremes During the 2020 and 2022 Market Crashes
- March 2020: index plunged to single digits as COVID panic peaked (ScienceDirect (academic publisher)).
- 2022 bear market: sustained readings below 25 for much of the year (CNN Business (major financial news outlet)).
Patterns of Greed in Bull Markets
- From mid-2020 to late 2021, the index repeatedly crossed above 80, indicating extended greed (Hightower Advisors (wealth management firm)).
- The 2021 peak (index >90) preceded the 2022 correction by several months.
“CNN’s Fear & Greed Index is an easy-to-read barometer of investors’ risk appetite.”
— CNN Business (major financial news outlet)
“Market sentiment indicators like the CNN Fear and Greed Index are best used as contrarian tools – buying when fear is high and selling when greed takes over.”
— Hightower Advisors (wealth management firm)
Confirmed facts
- The index uses a 0-100 scale (CNN Business).
- CNN’s version uses 7 specific indicators (Hightower Advisors).
- Alternative.me runs the crypto version (Alternative.me).
- Extreme fear has historically preceded market bottoms (ScienceDirect).
What’s unclear
- The exact weighting methodology is proprietary (CNN Business).
- Whether the index leads or lags is disputed (SSRN).
- Historical data from third parties may differ (GitHub).
- Short-term predictive power is debated (ScienceDirect).
Editor’s note: The Fear and Greed Index is a useful sentiment snapshot, but its limitations as a black-box indicator mean it should always be paired with broader market analysis.
Related reading: What Is the CNN Fear & Greed Index?
For a deeper look at how this sentiment indicator applies specifically to digital assets, see this Crypto Fear and Greed Index guide.
Frequently asked questions
How often is the Fear and Greed Index updated?
The CNN version updates once per trading day. The crypto version from Alternative.me refreshes daily as well.
Is the Fear and Greed Index a buy or sell signal?
It is not a direct signal. Extreme fear can indicate a buying opportunity, and extreme greed a selling opportunity, but it should not be used alone.
What is the difference between the stock and crypto Fear and Greed Index?
The stock index uses seven stock-market indicators; the crypto index uses six (volatility, momentum, social media, surveys, dominance, trends). Both use a 0–100 scale.
Can I use the Fear and Greed Index for options trading?
Yes, as a sentiment overlay. Extreme fear may increase the attractiveness of put-selling strategies, but the index does not time exact entries.
What does Extreme Fear mean for the market?
It suggests investors are panicking, which historically has been a contrarian buying opportunity for long-term positions.
What does Extreme Greed mean for the market?
It indicates overexuberance, often preceding a pullback. Contrarian traders may take profits or buy protection.
Is the Fear and Greed Index lagging or leading?
Research shows it has predicted equity returns over 2011-2020, but the relationship weakened in 2021-2024, suggesting it may be partly lagging in complex regimes.
More related posts
 Osso Buco Near Me: Best Places to Buy & Eat in Ireland (2025)
 How Long Is a Half Marathon? Distance, Time & Key Facts
 How to Make Iced Coffee: Cold Brew, Instant & Diabetic Tips
 Jeera Rice Near Me: Guide to Buying, Making & Health Facts
 Dermot Kennedy Tickets Dublin – 2026 Dates Prices How to Buy
 Best Places to Rent Near Galway City University (2025 Guide)
 How to Use TikTok for Beginners: Step-by-Step Guide
 Translate English to Chinese – Best Tools and Accuracy Tips